Stocks fell sharply during the Feb. 26-March 3 trading session after a slew of worrying economic and corporate reports, coupled with soaring oil prices — crude gushed to US$103 per barrel on March 2 — fuelled concerns about the health of the U. S. economy. The Dow Jones Industrial Average plummeted 426.02 points to 12,258.90, while the Standard & Poor’s 500 Index shed 49.95 points to 1,331.34.
But galloping commodity prices saw investors pouring money into metals and mining companies. Gold hit US$983.50 per oz. on March 3, up from US$948.70 on Feb. 26. The Amex Gold Bugs Index advanced 35.28 points to 501.65, while the Philadelphia Gold and Silver Index mounted 12.63 points to close at 202.98.
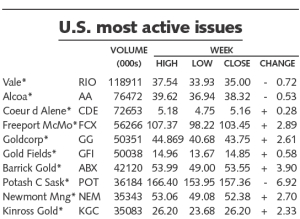
Agnico-Eagle Mines vaulted US$5.43 a share to US$71.51; Randgold Resources followed with a US$4.95 jump to US$53.92 per share; Lihir Gold gained US$4.01 to close the trading session at US$39.95; while Barrick Gold climbed US$3.90 to US$53.55. Goldcorp shares rose US$2.61 to US$43.75, and Kinross Gold added US$2.33 to close at US$26.20 a share.
Newmont Mining climbed US$2.70 to close at US$52.38 per share. The company announced that its Indonesian affiliate and the Indonesian government had filed for international arbitration in relation to its divestiture obligations at the Batu Hijau gold project.
The rejuvenation in farming and all-time record prices for products such as potash and fertilizers failed to buoy Mosaic Co., one of the world’s leading producers of concentrated phosphate and potash crop nutrients, or Potash Corp. of Saskatchewan. The latter shed US$6.92 a share to close at US$157.36, while Mosaic was down US$5.13 a share to US$111.93.
The stock that gained the most value during the trading session was Sociedad Quimica y Minera de Chile, soaring US$9.03 to close at US$198.53. The company is an inte- grated producer of potassium nitrate, iodine and lithium carbonate, as well as specialty plant nutrition products, and certain industrial chemicals, including industrial nitrates.
As a group, America’s coal producers all suffered losses.
| U. S. most active issues | ||||
| VOLUME | WEEK | |||
| (000s) | HIGH LOW | CLOSE | CHANGE | |
| Vale* RIO | 118911 | 37.54 33.93 35.00 | -0.72 | |
| Alcoa* AA | 76472 | 39.62 36.94 38.32 | -0.53 | |
| CoeurdAlene* CDE | 72653 | 5.18 4.75 5.16 | + 0.28 | |
| Freeport McMo*FCX | 56266 107.37 98.22 103.45 | + 2.89 | ||
| Goldcorp* GG | 50351 | 44.869 40.68 | 43.75 | + 2.61 |
| Gold Fields* GFI | 50038 | 14.96 13.67 14.85 | + 0.58 | |
| Barrick Gold* ABX | 42120 | 53.99 49.00 53.55 | + 3.90 | |
| PotashCSask* POT | 36184 166.40 153.95 157.36 | -6.92 | ||
| Newmont Mng* NEM | 35343 | 53.06 49.08 | 52.38 | + 2.70 |
| Kinross Gold* KGC | 35083 | 26.20 23.68 26.20 | + 2.33 | |
| U. S. greatest percentage change | ||||||
| VOLUME | WEEK | |||||
| (000s) | HIGH | LOW | CLOSE | CHANGE | ||
| Fischer-W Gld* | FWGO | 265 | 0.07 | 0.055 | 0.064 | + 42.2 |
| Diamond Discv* | DMDD | 316 | 0.011 | 0.006 | 0.011 | + 37.5 |
| Gemini Expl* | GXPI | 3093 | 0.084 | 0.052 | 0.07 | + 32.0 |
| Campbell Res* | CBLRF | 910 | 0.14 | 0.113 | 0.14 | + 30.8 |
| Pac Gold* | PCFG | 3927 | 0.05 | 0.035 | 0.05 | + 28.2 |
| Uranium Star* | URST | 414 | 0.15 | 0.12 | 0.15 | + 25.0 |
| Crystallex In* | KRY | 18450 | 2.34 | 1.65 | 2.05 | + 22.7 |
| NT Holding* | NTHH | 32 | 0.055 | 0.052 | 0.055 | + 22.2 |
| Apollo Gold* | AGT | 5804 | 0.74 | 0.605 | 0.74 | + 21.9 |
| Canarc Res* | CRCUF | 315 | 0.39 | 0.33 | 0.39 | + 21.8 |
| McKenzie Bay* | MKBY | 3018 | 0.03 | 0.014 | 0.015 | -50.0 |
| Evolving Gold* | EVOGF | 216 | 2.50 | 1.552 | 1.66 | -33.3 |
| HE-5 Res* | HRRN | 664 | 0.07 | 0.05 | 0.05 | -28.5 |
| Sparrowtech R* | SPMC | 199 | 0.03 | 0.015 | 0.015 | -25.0 |
| Global Gold* | GBGD | 16 | 0.55 | 0.40 | 0.40 | -24.5 |
| El Capitan Pr* | ECPN | 1344 | 0.28 | 0.18 | 0.20 | -24.5 |
| US Mine Maker* | USMM | 96 | 0.24 | 0.20 | 0.20 | -20.0 |
| Magnus Intl R* | MGNU | 75 | 0.38 | 0.30 | 0.30 | -14.2 |
| Little Squaw* | LITS | 57 | 0.77 | 0.68 | 0.68 | -11.6 |
| Crosshair E&M* | CXZ | 146 | 1.70 | 1.39 | 1.39 | -10.3 |
| U. S. greatest value change | |||
| WEEK | |||
| VOLUME | CLOSE | CHANGE | |
| Soc Quim&M Ch*SQM | 412425 | 198.53 | + 9.03 |
| Agnico-Eagle* AEM | 11908484 | 71.51 | + 5.43 |
| Randgold Res* GOLD | 3181917 | 53.92 | + 4.95 |
| Silver Std Re* SSRI | 7355155 | 38.46 | + 4.71 |
| Buenaventura* BVN | 3957671 | 76.88 | + 4.08 |
| ASA (Bermuda)* ASA | 339788 | 88.56 | + 4.08 |
| Teck Comin B* TCK | 10409585 | 41.59 | + 4.07 |
| Lihir Gold* LIHR | 863216 | 39.95 | + 4.01 |
| Barrick Gold* ABX | 42120208 | 53.55 | + 3.90 |
| Gold Mnrs ETF* GDX | 28640143 | 54.62 | + 3.683 |
| Rio Tinto* RTP | 1230336 | 454.00 | -7.75 |
| Potash C Sask* POT | 36183581 | 157.36 | -6.92 |
| Mosaic* MOS | 33651904 | 111.93 | -5.13 |
| CONSOL Energy* CNX | 15204032 | 76.30 | -5.02 |
| Cleveland-Cli* CLF | 7721656 | 121.91 | -4.20 |
| Seabridge Gld* SA | 1378267 | 25.701 | -2.899 |
| Yanzhou Coal* YZC | 648173 | 83.56 | -2.77 |
| Peabody Enrgy* BTU | 26415439 | 56.99 | -2.72 |
| Arch Coal* ACI | 23363197 | 52.11 | -2.72 |
| Massey Energy* MEE | 16654140 | 41.60 | -1.88 |
Be the first to comment on "U. S. MARKETS (March 10, 2008)"